LLM Observability and OpenTelemetry: Building Production Tracing for Enterprise AI Systems
A comprehensive guide for enterprise architects on implementing OpenTelemetry GenAI semantic conventions, distributed tracing, token cost attribution, and privacy-first payload sanitization across production LLM workflows.
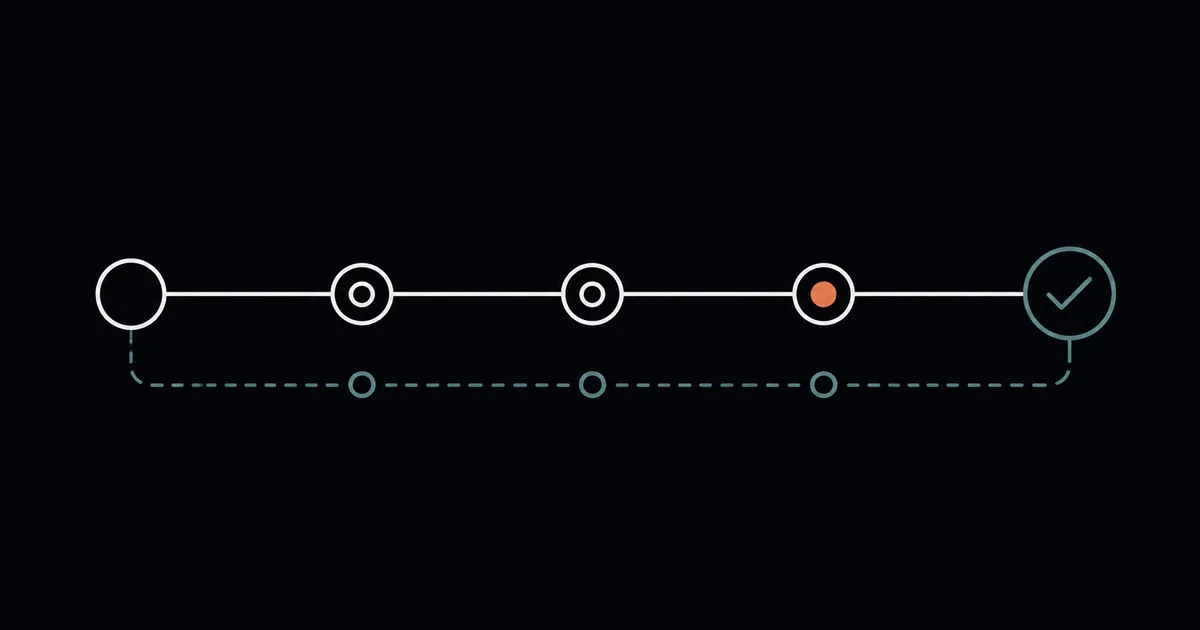

As enterprise AI applications transition from single-prompt chatbots to production multi-agent workflows, legacy Application Performance Monitoring (APM) tools are encountering fundamental limitations. Traditional HTTP metrics like status codes and overall request latency fail to capture the non-deterministic reasoning loops, token usage costs, model parameters, and multi-hop tool calls inherent in Generative AI architecture. Without vendor-agnostic distributed tracing, engineering teams face black-box production failures, unpredictable token consumption, and unmonitored data exposure. Standardizing enterprise telemetry around OpenTelemetry (OTel) GenAI semantic conventions provides a unified, future-proof observability foundation that delivers real-time trajectory visualization, precise cost attribution, and strict payload sanitization without vendor lock-in.
Why Traditional APM Fails for Enterprise Generative AI Workflows
Standard APM platforms were engineered around deterministic microservices, where an incoming request maps to predictable database queries and downstream REST calls. In Generative AI architecture, a single user input can trigger a dynamic chain of model calls, vector database retrievals, external API executions, and iterative retry loops.
Traditional APM tools record these complex executions as flat, long-running HTTP POST requests to an LLM provider endpoint. This creates significant operational visibility gaps:
- Non-Deterministic Execution Paths: Two identical user prompts may execute completely different tool paths or reasoning chains based on intermediate model outputs.
- Hidden Latency Bottlenecks: Time-to-first-token (TTFT), vector search embedding retrieval, tool execution, and generation throughput are lumped into a single opaque duration metric.
- Uncaptured Token Economics: Standard HTTP headers do not track prompt tokens, completion tokens, or cached token hits, preventing accurate cost allocation across departments or tenant accounts.
- Missing Reasoning Trajectories: When an autonomous agent enters an infinite loop or selects an invalid tool, conventional logging lacks the parent-child span hierarchy required to inspect the failure point.
While pre-deployment evaluation frameworks and offline CI/CD trajectory benchmarking—as discussed in our guide on Agentic AI Workflow Architecture—validate system behavior prior to release, runtime observability requires live distributed span tracking across every production request. The industry shift toward vendor-agnostic OpenTelemetry standards ensures enterprise observability stays independent of specific model providers or visualization backends.
Related: Model Context Protocol (MCP): The Enterprise USB-C for Connecting AI Agents to Legacy Systems
The OpenTelemetry GenAI Standard: Semantic Conventions for Spans and Metrics
To resolve fragmented, vendor-specific logging formats, the OpenTelemetry Project published standardized semantic conventions specifically for Generative AI systems. Adopting gen_ai.* attributes establishes a uniform taxonomy across all models, frameworks, and cloud environments.
Under the OpenTelemetry GenAI specification, every model invocation is represented as a span enriched with standardized metadata:
OpenTelemetry GenAI Span Attribute Structure
├── gen_ai.provider.name            # "openai", "anthropic", "ollama", etc.
├── gen_ai.request.model           # "gpt-4o", "claude-3-5-sonnet", etc.
├── gen_ai.request.temperature     # Model generation parameters
├── gen_ai.request.top_p           # Nucleus sampling value
├── gen_ai.usage.input_tokens      # Prompt token count
├── gen_ai.usage.output_tokens     # Completion token count
└── gen_ai.response.finish_reasons # ["stop", "length", "tool_calls"]
Key attributes defined in the OpenTelemetry GenAI specification include:
- Provider and Model Identifiers:
gen_ai.provider.namerecords the target AI provider, whilegen_ai.request.modelandgen_ai.response.modeltrack the requested versus actual serving model version. - Token Usage Metrics:
gen_ai.usage.input_tokensandgen_ai.usage.output_tokenscapture exact resource consumption for every individual completion call. - Execution Parameters:
gen_ai.request.temperature,gen_ai.request.max_tokens, andgen_ai.request.top_precord generation settings to audit behavioral changes. - Completion States:
gen_ai.response.finish_reasonscaptures why generation ended, revealing token limit truncation or tool call triggers.
By enforcing these semantic conventions at the application layer or API gateway, enterprises can route telemetry data seamlessly into any compliant backend—including open-source platforms like Langfuse or enterprise APMs like Datadog—without rewriting instrumentation code when switching platforms.
Related: AI Assistant Cost Guide: Enterprise Budgeting & Calculation
Implementing Distributed Tracing Across Multi-Step Agent Trajectories
Enterprise AI workflows rarely consist of a single LLM request. Production agentic architectures involve multi-step trajectories: receiving a user query, generating embedding vectors, querying a vector store for Retrieval-Augmented Generation (RAG), calling an external tool over the Model Context Protocol (MCP), evaluating intermediate results, and synthesizing a final response.
Distributed tracing preserves the execution context across these multi-service boundaries using W3C Trace Context headers (traceparent and tracestate). This hierarchy connects isolated actions into an end-to-end execution tree:
Root Span: Customer Support Agent Trajectory (TraceID: 4bf92f35)
├── Span 1: Vector Search Embedding Generation (gen_ai.provider.name: openai)
├── Span 2: Vector DB Query (db.system: qdrant, latency: 45ms)
├── Span 3: LLM Reasoning Step (gen_ai.provider.name: anthropic, input_tokens: 1240)
│   └── Child Span 3.1: MCP Tool Execution (tool.name: fetch_account_balance)
└── Span 4: Final Answer Generation (gen_ai.provider.name: anthropic, output_tokens: 310)
Visualizing multi-step execution trees allows engineering teams to identify critical performance patterns:
- Latency Breakdown: Pinpoint whether delayed responses stem from slow vector retrieval, model queueing, or third-party tool execution.
- Agent Trajectory Divergence: Identify where an autonomous agent took an inefficient sub-goal path or initiated redundant tool calls.
- Error Propagation: Track how a downstream database timeout or malformed JSON tool response propagates up to the user-facing interface.
Related: KVKK and AI: What Turkish Companies Can and Can't Send to ChatGPT
Privacy-First Telemetry: Runtime Payload Sanitization and Governance
Telemetry streams that capture raw LLM inputs and outputs present substantial security and compliance risks. Prompts frequently contain proprietary business context, customer details, or personal data. Sending unmasked payload streams directly to external telemetry backends can violate data protection regulations such as KVKK or GDPR.
Enterprise observability architectures implement a privacy-first collector pipeline that sits inside the corporate perimeter. Before telemetry spans exit the internal network, an inline OpenTelemetry Collector transforms and sanitizes payload content:
[ LLM Application ] ──(Raw Traces + Prompts)──> ┌──────────────────────────────────────┐
                                                │ OTel Collector (In-Perimeter)       │
                                                │  ├── PII Redaction Filter            │
                                                │  ├── System Prompt Masking           │
                                                │  └── Regex Token Anonymization       │
                                                └──────────────────────────────────────┘
                                                                   │
                                                      (Sanitized Traces & Spans)
                                                                   ▼
                                                [ Enterprise APM / Tracing Backend ]
Essential runtime sanitization controls include:
- PII and Sensitive Data Masking: Automated scrubbing of national identification numbers, credit card tokens, personal email addresses, and customer names using pattern-matching processors within the OpenTelemetry Collector.
- Configurable Payload Capture: Capability to record full prompt-completion text in non-production staging environments while restricting production telemetry strictly to metadata, span durations, and token counts.
- System Prompt Safeguarding: Automatic suppression of internal system instructions and proprietary contextual documents from public APM log streams to prevent intellectual property leaks.
- Role-Based Telemetry Scoping: Restricting access to detailed prompt trace payloads to authorized security and AI safety teams while granting engineers aggregate metric access.
Related: Enterprise AI ROI Framework: Measuring Automation Value Beyond Cost Savings
Real-Time Token Cost Attribution and Latency Debugging
A primary challenge in enterprise LLM deployment is managing variable operational costs. Because model providers charge per token, unmonitored background agents or unoptimized prompt templates can rapidly exceed allocated budgets.
By standardizing telemetry on OpenTelemetry gen_ai.usage.* attributes, finance and platform engineering teams can build real-time cost attribution dashboards:
- Cost-Per-Trace Aggregation: Multiplying recorded
input_tokensandoutput_tokensby provider unit pricing to calculate exact financial cost per transaction, customer request, or business unit. - Tenant and Department Tagging: Attaching contextual attributes (e.g.,
tenant.id,department.name,feature.flag) to root spans to enable precise internal showback and chargeback models. - Cache Efficiency Tracking: Monitoring prompt-cache hits and context reuse to quantify savings achieved through structured prompt engineering.
In addition to financial visibility, correlated telemetry simplifies latency debugging. Splitting total request time into Time-to-First-Token (TTFT) and Generation Throughput (tokens per second) allows teams to determine whether latency issues are caused by initial prompt processing overhead or slow token streaming from the model host.
Next Steps for Enterprise AI Observability
Transitioning from basic logging to standardized OpenTelemetry tracing is critical for scaling enterprise AI applications with confidence, security, and cost control.
If your organization is scaling production LLM workflows or looking to implement vendor-agnostic AI telemetry, Orbitra AI provides specialized architectural support:
- OpenTelemetry AI Readiness Audit: Evaluate your existing AI pipelines, tool integration points, and telemetry infrastructure to design an OpenTelemetry GenAI migration strategy.
- Custom Telemetry Pipeline Engineering: Implement self-hosted OpenTelemetry Collector architectures featuring inline PII sanitization, KVKK/GDPR compliance filtering, and secure APM routing.
- Agent Tracing & Cost Attribution Setup: Deploy end-to-end distributed tracing across multi-agent systems, vector stores, and custom MCP integrations with real-time cost tracking dashboards.
Schedule a consultation with an Orbitra AI Architect to build a secure, vendor-agnostic observability foundation for your enterprise AI systems.